
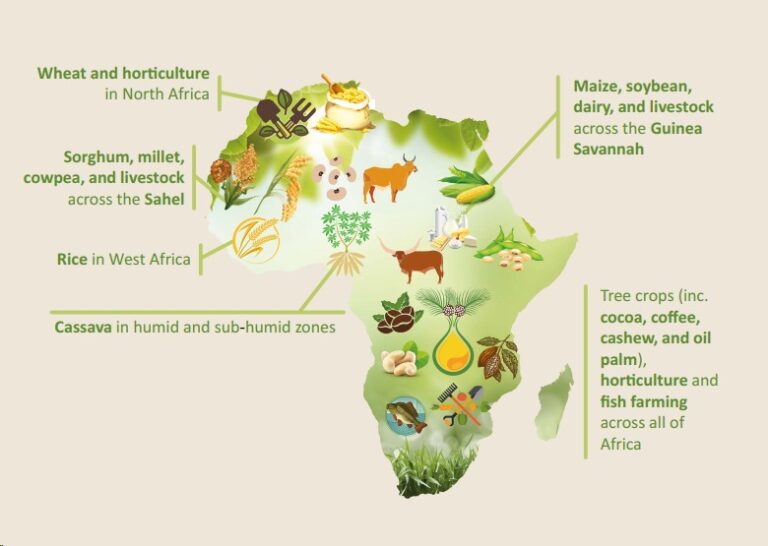
Africa's Food Trade Landscape
The landscape of food trade within Africa has undergone notable shifts, with the Southern African Development Community (SADC) and the Common Market for Eastern and Southern Africa (COMESA) emerging as dominant players in intra-African agricultural exchanges across various processing levels. Recent statistics spanning 2019 to 2021 illuminate key trends and regional dynamics that shape the continent’s food trade.
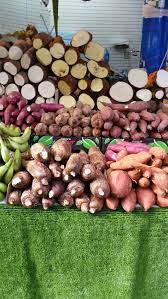
Unprocessed and unpacked products
By exporting raw agricultural products instead of processed goods, African nations often miss out on the potential value addition that comes from processing. This means they lose the opportunity to capture higher margins and profits that come with processing and adding value to products before export. This reliance on exporting raw materials can lead to economic vulnerability, as the market prices for raw materials are more volatile compared to processed goods.
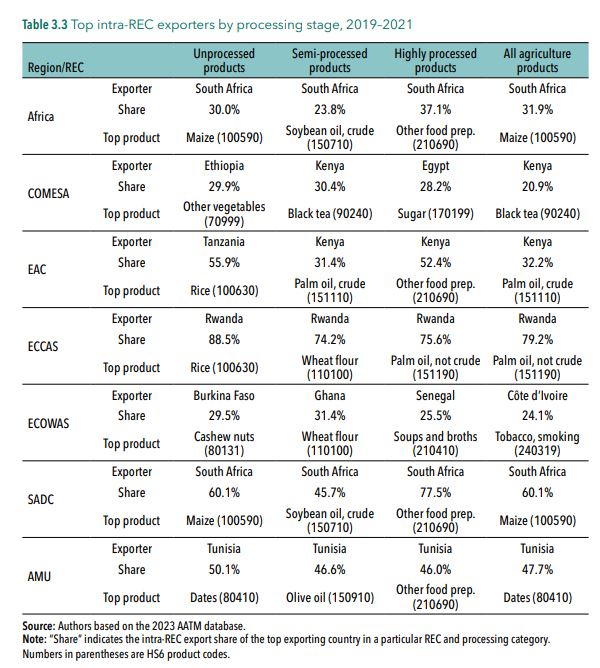
Regional Dominance and Evolution
In this period, SADC commanded a substantial portion, accounting for 54% of all intra-African agricultural exports, with COMESA following at 34%. Notably, their dominance varies concerning different processing levels, with SADC holding a larger share for semi-processed products (58%) compared to highly processed ones (50%). Conversely, COMESA’s influence leans more towards semi-processed goods (50%) over highly processed products (37%).
Interestingly, despite its smaller GDP and population share compared to COMESA, SADC’s trade contribution surpasses expectations. SADC’s pivotal role in intra-African exports stands out, with its trade share notably greater than its GDP and population share.
The composition of intra-African exports has seen a significant transformation since 2003–2005. SADC has remained a prominent source despite a slight decline in market share, particularly in processed exports. COMESA and the East African Community (EAC) have notably surged in export market shares across processed and unprocessed products. In contrast, other regions like the Economic Community of West African States (ECOWAS) have experienced fluctuations in their contribution to intra-African exports.
Country Dynamics in Intra-African Trade
Figures reveal the top 10 countries in terms of average value for intra-African agricultural exports and imports during the 2019–2021 period. South Africa emerges as a dominant force, leading both exports and imports, capturing a substantial 31.9% share of intra-African agricultural exports and 8.4% of imports. Egypt, Kenya, and Morocco also hold significant positions in both exporting and importing within the continent.
However, the landscape isn’t solely defined by larger nations. Smaller players, such as Eswatini and Lesotho, share the stage by contributing significantly to intra-African trade. Their extensive trade with South Africa showcases the intricate web of regional trade partnerships and the influence of geographic proximity.
Conclusion
The dynamics of intra-African food trade in 2023 portray a complex interplay of regional dominance, evolving trade compositions, and the involvement of both major economies and smaller nations. The prominence of SADC and COMESA, coupled with the shifting trade patterns among different processing levels, underscores the multifaceted nature of the continent’s agricultural trade landscape. Understanding these trends is crucial for policymakers and stakeholders aiming to foster inclusive and sustainable trade practices across Africa.
Source: https://www.resakss.org/sites/default/files/Africa%20Agriculture%20Trade%20Monitor%202023_0.pdf